Tag Archives: Native Americans

The Census Bureau is Producing Lesson Plans for Elementary Education: The Results are Not Good

I know that teaching elementary school is a difficult job, and that is why I am pretty forgiving about some of the mistakes that teachers make. We all get things wrong once in a while. If no malice is involved, let’s fix the problem and move on.

The Census Bureau, of all agencies, produced a lesson plan on “Native American Dwellings.” It is part of a program called, apparently, “Classrooms Powered by Census Data.”

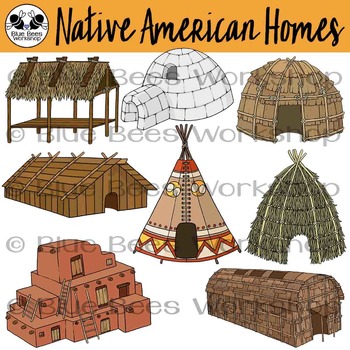
This particular plan is geared toward children in second- and third-grade. Students who achieve the learning outcomes “will be able to observe differences among three types of Native American dwellings,” write about the differences they observed, and “be able to compare their observations about Native American dwellings to other information about the dwellings.” Mind you, the activity requires that children look at just three types of Native American dwellings–“teepees, pueblo adobe structures, and hogans.” Who used each type of dwelling? Why was it used? From what materials was it made? What, the children will be asked to imagine, was life like in each home?

Students should learn more than they do about Native Americans, but exercises like these are pernicious. The Census Bureau is not alone in producing educational material like this, and it has been going on for a long time. But with so much data at its disposal, certainly the Census Bureau has the ability to do much better.

An old exercise, demonstrating some of the same faults the Census Bureau lesson plan possesses.

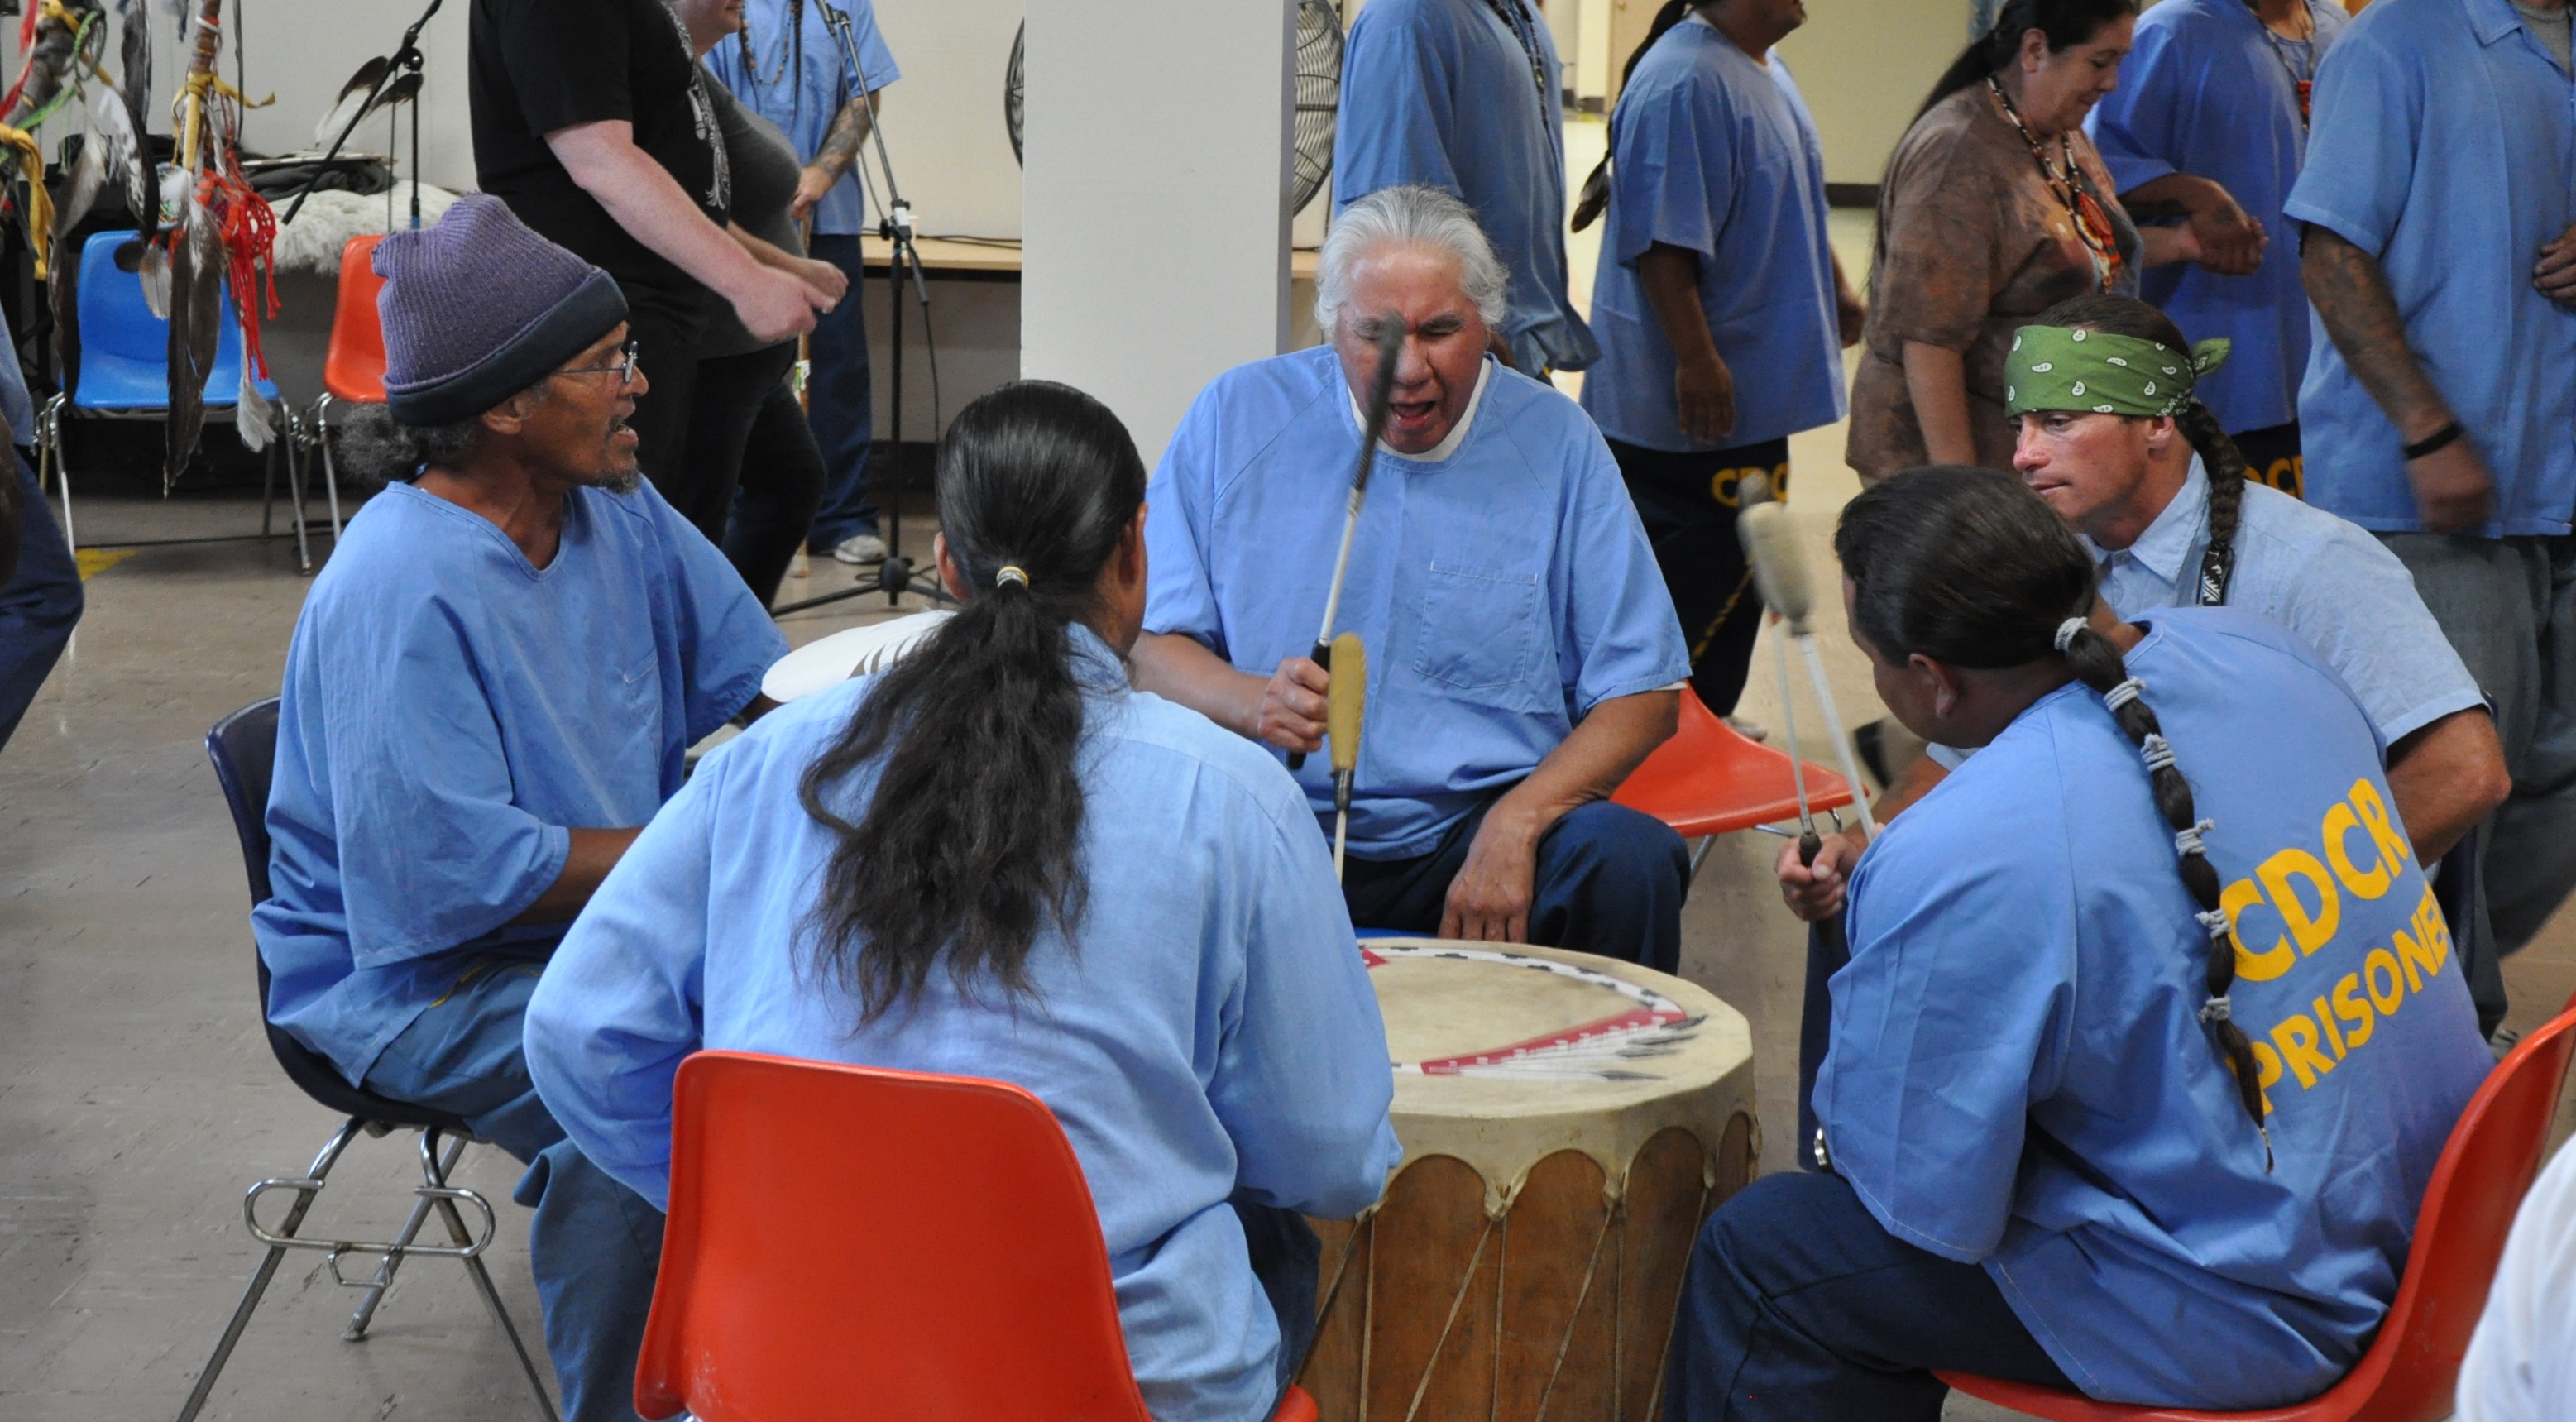
It focuses exclusively on the Native American past to the exclusion of the present. Students could complete the exercise and realize that Indigenous peoples still exist and that they live in homes very much like theirs.

The Census Bureau does maintain data on Native American housing, down to the level of the percentage of homes that have indoor plumbing and kitchens inside the house. This assignment focuses only upon images of the past.

An Image from the Census Bureau lesson plan.

So what?

When educators emphasize images rooting Indigenous peoples in the past, they are aiding in erasure of Indigenous peoples in the present. And if they are part of the past, it becomes easier to dismiss the legitimate claims of native peoples as being out of time and place and, as a consequence, irrelevant. When teachers describe Native peoples to their students as part of the past, they assist, however unwittingly, in making it more difficult for many Americans to recognize the importance of native peoples’ calls for justice today.

COVID-19 in Indian Country, April 12th, 2020.

There is plenty of news coverage of the Coronavirus Pandemic, but information on how the outbreak is affecting native peoples is harder to find. I know that many of my students are interested in this most important story, so perhaps yours will, too. I will post the stories I find to the blog as frequently as my other duties permit.

New Mexico Governor Michelle Lujan Grisham has been bringing attention to her state’s struggle against the outbreak, pointing out that the state faces a unique challenge. On CNN Sunday, she said that 25% of the state’s COVID-19 cases are Native American. “Some of these areas, particularly in Navajo nation, you’re in a situation where you’ve got folks living without access to water and electricity and this creates unique challenges.” Governor Lujan Grisham is one of the few public elected officials to bring up racial disparities in coronavirus cases with reference to native peoples. The Arizona Department of Health Services has pointed out similar figures. 4.6 of Arizonans are American Indian or Alaska Native, according to the Census Bureau, but “Native Americans make up 16% of those who have died from COVID-19, among the cases for which race and ethnicity are known.” Governor Lujan Grisham said on CNN that “We’re looking at a regional strategy to support the leadership at the Navajo Nation between Utah, Arizona, and New Mexico.” Efforts so far, she said, include setting up field hospitals and triage centers, and delivering food through the National Guard. More on the figures from Arizona and the Navajo Nation can be found here, here, here, and here.

The New York Times has begun to look at factors related to ethnicity, race, and class that intersect with pandemic mortality. Meanwhile, National Geographic reported on the first coronavirus deaths in the Amazon. Surgeon General Jerome Adams, while pointing out that people of color were not biologically or genetically prone to infection, said, according to a piece in Yahoo Finance, that “known health predispositions that have dogged black, Latino and Native American populations historically,” like “asthma, high blood pressure and obesity all exacerbate COVID-19’s effects.”

There is plenty of bad news. But as historians who study Native American history know, native peoples have always reacted creatively in the face of epidemic disease. An AP story over the weekend shows how “Native Americans across the u.S. are organizing online and social-distancing powwows and posting videos of dances as a way to offer hope and spiritual support during the coronavirus pandemic.” You can read about it here.

That’s all for today. Stay safe, everybody, and stay home.

Incarceration Rates for Native Americans

Many of my students have seen The 13th, the scathing documentary that looks at the close relationship between racism and violence in modern America.  Not only does the United States, with 5% of the world’s population, incarcerate nearly a quarter of the people on earth who live their lives behind bars, but it does so in a manner where African Americans are are disproportionately represented in the prison population.  Racism is alive and well in this Incarceration Nation.

I spend a lot of time thinking about the prison system.  My good friend runs a blog detailing her experiences as the wife of an inmate incarcerated under New York’s inhumane Rockefeller drug laws.  And many of our students read Heather Thompson’s book on Attica last fall.  Professor Thompson was on campus, as were a number of people who had been involved in the Attica uprising and its aftermath. A student in my Indian Law class asked about incarceration rates for Native Americans.  I had always assumed that Native Americans, in states with large Native American populations, were over-represented in those state prison populations.

There is information on jails in Indian Country here. It is a broad, national picture.  For the Native American population incarcerated in “local jails,” which are defined as “confinement facilities administered by local or regional law enforcement agencies and private facilities operated under contract to such agencies. They exclude jails administered by federal, state prison, or tribal authorities,” you can read more here. For the federal prison system, an overview can be found here.

In Montana, where I lived and taught for four years. Native Americans were significantly over-represented in the states prison population. The Prison Policy Initiative has assembled a really helpful website that allowed me to increase my understanding of this important issue.


2010 graph showing incarceration rates per 100,000 people of various racial and ethnic groups in Montana


racial and ethnic disparities between the prison/jail and general population in MT as of 2010

For Arizona, a state with a large Native American population, the figures are a bit less stark than they are for Montana.


racial and ethnic disparities between the prison/jail and general population in AZ as of 2010


For other states with large Native American populations, here is a run down on the figures:

State                                          Percentage of Population           Percentage of Incarcerated Population

New Mexico                                               9%                                                           11%

South Dakota                                            9%                                                            29%

North Dakota                                            5%                                                            29%

Utah                                                            1%                                                             4%

Washington                                              2%                                                              5%

Oklahoma                                                 7%                                                              8%

Alaska                                                        15%                                                          38%

Minnesota                                                 1%                                                             8%

For other states, you can see the reports here, including tables on the number of people in each racial demographic per 100,000 in population by clicking here.