
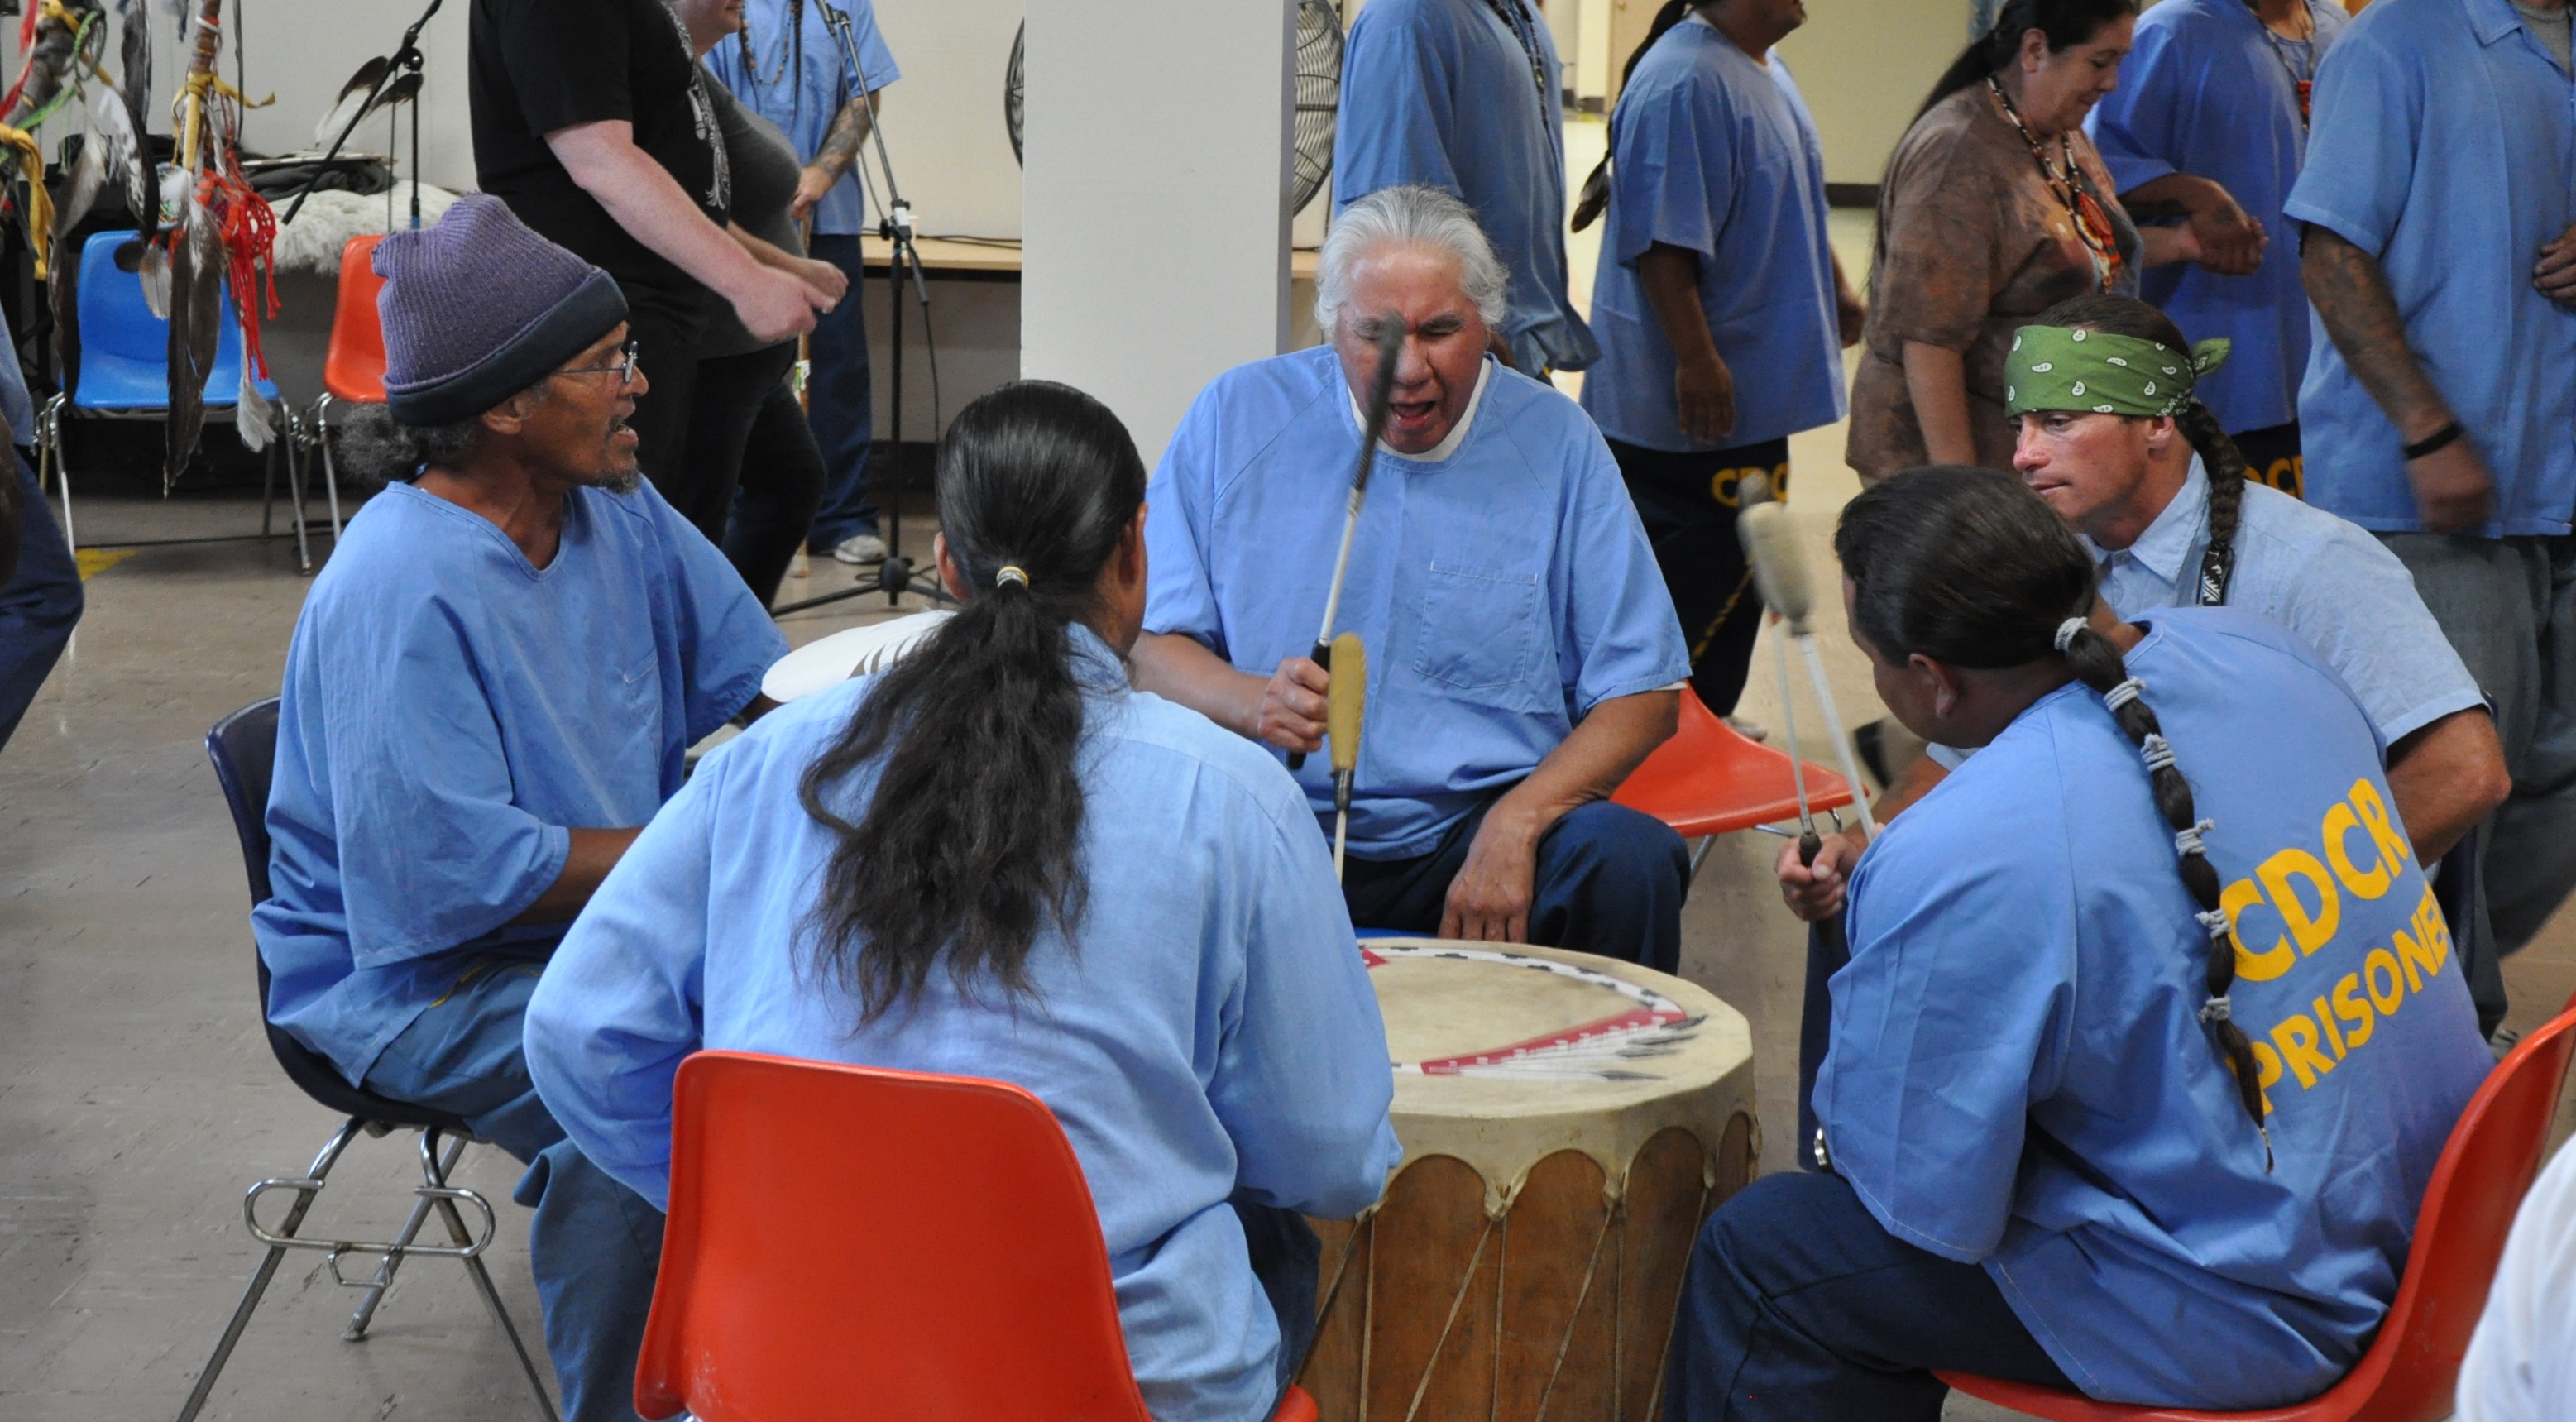
Many of my students have seen The 13th, the scathing documentary that looks at the close relationship between racism and violence in modern America. Not only does the United States, with 5% of the world’s population, incarcerate nearly a quarter of the people on earth who live their lives behind bars, but it does so in a manner where African Americans are are disproportionately represented in the prison population. Racism is alive and well in this Incarceration Nation.
I spend a lot of time thinking about the prison system. My good friend runs a blog detailing her experiences as the wife of an inmate incarcerated under New York’s inhumane Rockefeller drug laws. And many of our students read Heather Thompson’s book on Attica last fall. Professor Thompson was on campus, as were a number of people who had been involved in the Attica uprising and its aftermath. A student in my Indian Law class asked about incarceration rates for Native Americans. I had always assumed that Native Americans, in states with large Native American populations, were over-represented in those state prison populations.
There is information on jails in Indian Country here. It is a broad, national picture. For the Native American population incarcerated in “local jails,” which are defined as “confinement facilities administered by local or regional law enforcement agencies and private facilities operated under contract to such agencies. They exclude jails administered by federal, state prison, or tribal authorities,” you can read more here. For the federal prison system, an overview can be found here.
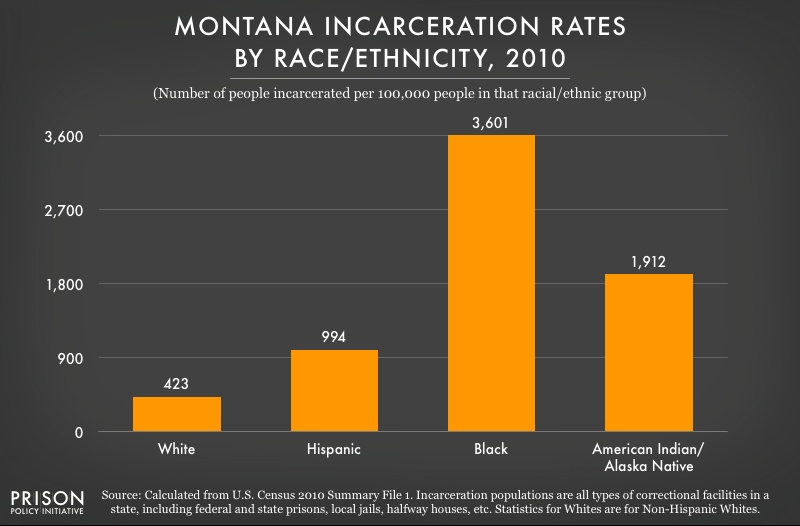
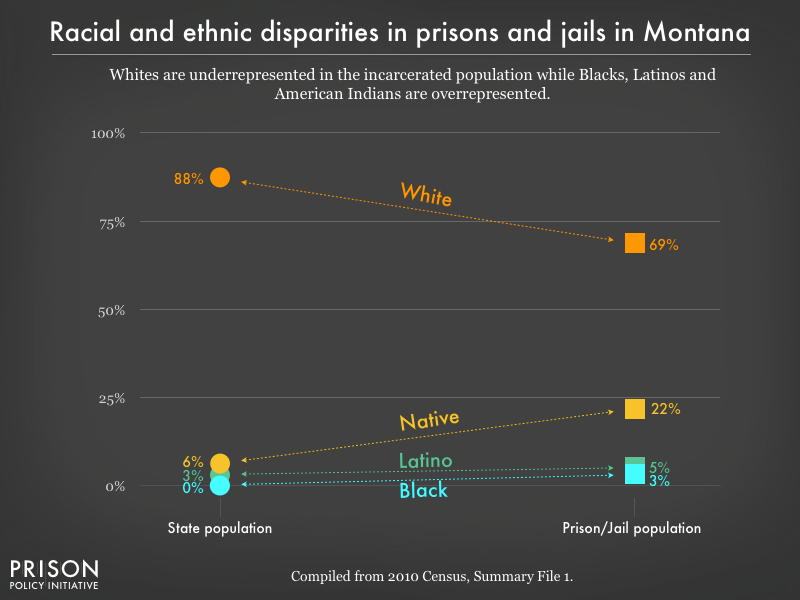
In Montana, where I lived and taught for four years. Native Americans were significantly over-represented in the states prison population. The Prison Policy Initiative has assembled a really helpful website that allowed me to increase my understanding of this important issue.
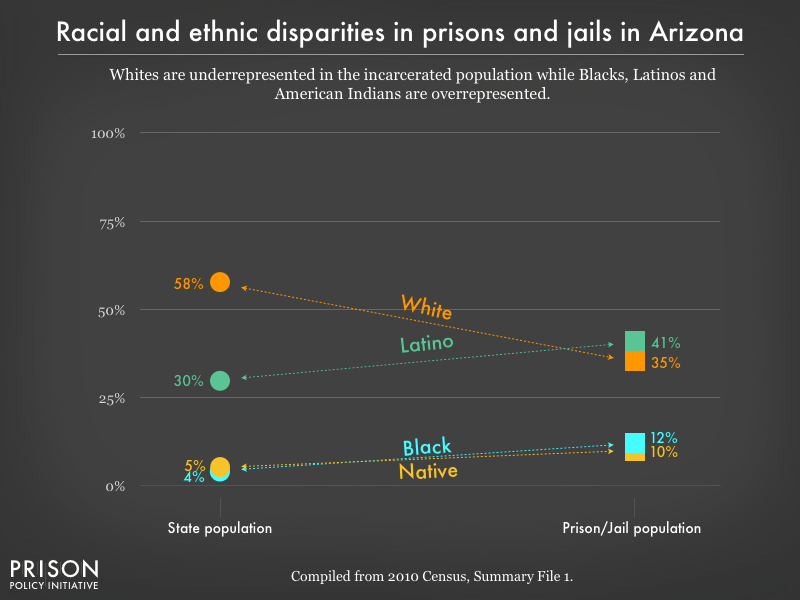
For Arizona, a state with a large Native American population, the figures are a bit less stark than they are for Montana.
For other states with large Native American populations, here is a run down on the figures:
State Percentage of Population Percentage of Incarcerated Population
New Mexico 9% 11%
South Dakota 9% 29%
North Dakota 5% 29%
Utah 1% 4%
Washington 2% 5%
Oklahoma 7% 8%
Alaska 15% 38%
Minnesota 1% 8%
For other states, you can see the reports here, including tables on the number of people in each racial demographic per 100,000 in population by clicking here.